

The Dashboard Autopsy
How I Found the Leak That Killed My $5,000 Monthly Baseline


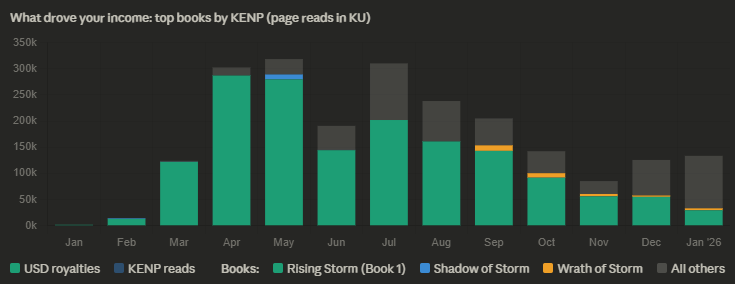
In April 2025, my royalties looked like a mortgage payment on a house I didn’t even own yet. I thought I had finally, after years of grinding, cracked the secret of the Amazon algorithm.
By October, someone had cut the power.
My revenue didn’t just dip – it hemorrhaged. I fell to less than 20% of that spring peak. I spent my nights staring at the KDP “red bars” like they were a crime scene. I made decisions out of pure, cold panic. I delisted books, went “Wide,” and sprinted toward experimental projects because I was convinced the market had simply decided it hated me.
I was wrong. The market didn’t change. My mechanics did.
I only found the truth when I stopped treating my dashboard like a diary and started treating it like a forensic file. I used a Large Language Model (LLM) to perform a “No-Sycophant Audit” of my career.
The Method: Dealing with the CSVs
Some authors treat their reports like a report card – they check the grade (the royalty total) and then shut the laptop.
To find the truth, you have to look at the blood on the page. I exported 18 months of raw CSV data – KENP page reads, order summaries, and royalty streams. I fed them into Gemini with one command:
“Challenge my assumptions. Do not tell me what I want to hear. Analyze these files and find the structural leaks. Tell me exactly why my baseline shattered and where the data says I’m wasting my time.”
The “Series Decay” Diagnosis
The AI found a terminal leak I had completely missed.
I had a five-book series I considered my “anchor.” But the AI ran a funnel analysis and showed me a brutal reality: 60% of my readers were hitting a dead end after Book 1. While I was celebrating a high Book 1 rank, I was ignoring the fact that my sequels weren’t catching the hand-off. I was working three times as hard to find “new blood” for the series starter rather than simply keeping the readers I already had. I wasn’t failing at marketing; I was failing at the “Next Book” experience.
The Ghost vs. The Rising Star
This was the hardest part to swallow. I had been pouring my soul into a companion book for my flagship series because I felt I “owed” it to a fan base I thought was still there.
The AI compared my recent releases and gave me a reality check:
The Ghost Book: A title with 80+ five-star ratings but zero traffic. It was a beautiful car with no gas in the tank.
The Rising Star: A newer project with slightly lower “social proof” but massive, organic velocity. Thousands of page reads were appearing without me spending a single dime on ads.
The AI’s verdict? “You are writing out of loyalty for a shrinking group of 100 people, while 10,000 new readers are currently waiting for a sequel to your newest project. You are writing defensively.”

Defensive vs. Offensive Writing
This concept changed how I look at my “To-Do” list.
Defensive Writing: This is fear-based. It’s trying to save a declining brand with “experiments” or niche side-stories because you’re scared of losing what you built.
Offensive Writing: This is feeding the fire. It’s identifying the “green sprouts” the data is already voting for and doubling down on them before the momentum dies.
My data showed that my “Post-Apocalyptic Cat-POV” series was my new front door. The algorithm was practically screaming at me to feed that project, but I was too busy trying to patch the holes in my old “shattered” titles to notice the win right in front of me.

Audit Your Own Career
If your dashboard feels like a horror movie, stop guessing. Use the tools to act like the CEO of your own catalog:
Dump the Raw Data: Graphs are for vanity. CSVs are for truth.
Correlation is King: Don’t ask if your book is “good.” Ask the AI to find the exact date your sales velocity dropped and line it up with your release schedule or ad spend.
The 90-Day Cliff: Check your royalties exactly three months after your last release. If the floor drops by half, you don’t have a brand; you have a “New Release” subsidy.
Identify the True North: Look for the book with the highest ratio of “Page Reads” to “Ad Spend.” (You can export Facebook Ad data to CSV too)
That is your real career. Everything else is a hobby.
I’ve shelved my experiment. I’m currently sprinting on the sequels for my two highest-performing projects. I didn’t make this choice because it “felt” better – I made it because the data proved my dreams weren’t dead. They were just misaligned.
The magic didn’t go away. I just stopped feeding the engine.
Paid subscribers get the full audit prompt. Seven diagnostic sections, ready to paste. One thing worth knowing: run it on two models with the same data. Gemini and Claude will disagree on something. That disagreement is usually the most valuable part of the analysis.
Very insightful. Thank you for sharing!